Immediately, you are presented with the core area of Nessus – the My Scans panel.
Scan Details
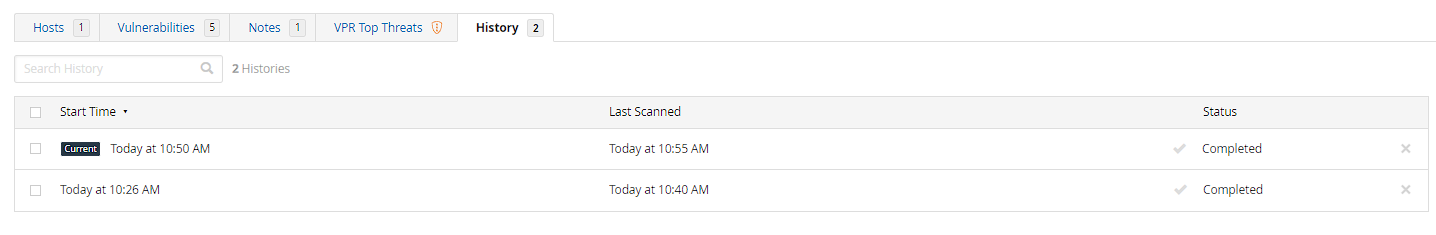
This page gives you more details about the scan, including the status of the scan, how long it took, and when it took place. Additionally, Nessus also includes the History of a scan, which allows you to see each time it was launched, as well as the results of each historical scan. This is useful in comparing the results of scans performed across a range of time.
**Settings**
You can see details about the Nessus server itself by going to the Settings panel (found by clicking on the Settings hyperlink in the top navigation bar). In the About section, the Overview tab displays details about the Nessus server, including its version number and when it was last updated. If the Nessus scan results need to be encrypted, an encryption password can also be set in the About section, using the Encryption Password tab.
Users with administrative permissions on the Nessus server (for example, the nessus-user account) can also adjust the configuration of Nessus from the Advanced Settings section of the Settings. Any changes to settings made here are global and will affect all Nessus users. Some changes also require restarting the Nessus server.
### Network Scanning
Nessus is primarily used to scan devices on a network and comes with several pre-configured scan templates to begin scanning with Nessus. In this lab, explore the Host Discovery and Basic Network scan templates offered by Nessus, and use them to scan a range of targets.
### Scanning with Nessus
Nessus is a vulnerability scanner; therefore, scanning systems is its primary function, with a range of scan templates to help facilitate the creation of scans and policies.
A scan is simply Nessus assessing the host for vulnerabilities based on pre-determined rules. Nessus includes several different types of pre-configured scans, all with different built-in rules, and can be launched any number of times against multiple hosts.
### Scan Templates
Using the Nessus web interface, open the My Scans panel and click the New Scan button to show all Nessus templates available. For Nessus Essentials users, any scan template not marked as UPGRADE is available for you.
Some templates are used to identify vulnerabilities related to specific malware or exploits (such as the WannaCry Ransomware, or Spectre and Meltdown templates). In contrast, others focus on searching for vulnerabilities more generally.
### Host Discovery scans
Identifying the hosts on a network should always be the first step in a vulnerability assessment. Nessus provides a Host Discovery scan that allows users to scan a network for live hosts, and output a list of basic information about each device it discovers. This scan can also perform a simple port scan, identifying open ports on live hosts, but this behavior is disabled by default.
Click the Host Discovery button from the Scan Templates page to start configuring a new Host Discovery scan. You'll be presented with the configuration panel for the scan, where you can configure the Name, Description, and Targets fields.
Image 10
As with most Nessus scans, you're only required to complete two fields in the configuration panel before the scan is ready to launch: In the General tab, you must enter a Name (the name of the scan), and a list of Targets.
When specifying targets, Nessus supports CIDR notation (e.g. 10.10.10.0/24), a range (e.g. 10.10.10.0-10.10.10.255), or a comma-separated list (e.g. 10.10.10.121, 10.10.10.232, 10.10.10.255). Nessus also supports adding domain names to this field (e.g. immersivelabs.com).
Alternatively, targets can be added to a text file and uploaded to Nessus by clicking the Add File link. If a file of targets is added, the Targets field will be automatically populated with the contents of this file when the template is saved.
You can customize the Host Discovery scan to meet your needs by adjusting the Scan Type setting in the Discovery tab. Host enumeration (the default) checks if the host is live by pinging the host and reporting the results. In contrast, the Host Discovery scan can be configured to attempt to perform OS Identification, and can even be configured to perform a port scan of the host. You can fine-tune any options by choosing the Custom option, which will display an additional section under the Discovery tab.
scan type
Unlike other scan templates, the Host Discovery scan doesn't attempt to identify any vulnerabilities on a system. It's just used for enumeration (discovery) purposes, so there are few other options to configure. You can adjust the verbosity that Nessus will report on results in the Report tab, as well as change options related to the scan performance in the Advanced tab. Once your scan is ready to launch, click the Save button to create the scan and return to the My Scans table. You should see your new scan added to the table.
\
---
# Agent Instructions: Querying This Documentation
If you need additional information that is not directly available in this page, you can query the documentation dynamically by asking a question.
Perform an HTTP GET request on the current page URL with the `ask` query parameter:
```
GET https://oklencodes.gitbook.io/untitled/vulnerability-management/nessus/nessus-essentials.md?ask=
```
The question should be specific, self-contained, and written in natural language.
The response will contain a direct answer to the question and relevant excerpts and sources from the documentation.
Use this mechanism when the answer is not explicitly present in the current page, you need clarification or additional context, or you want to retrieve related documentation sections.