# The CloudWatch Dashboard
CloudWatch is an AWS native monitoring solution that lets you visualize user/API activity in your account by measuring metrics and viewing them in dashboards. It can capture metrics directly from some AWS services, calculate them from log groups, or import them from third parties.
### CloudWatch explained
As with most AWS services, you can access CloudWatch functionality through the API and CLI, but most of its value comes from the management console, where you can view the dashboards and metrics. For this lab, we'll be using the management console.
To integrate CloudTrail into CloudWatch, we'll be using a log group. We'll configure a trail to forward its events to a log group where they are stored separately to any S3 storage. From here, we can use the functionality of CloudWatch, such as dashboards and widgets, to improve the visibility of activity happening in the account.
### The CloudWatch console
\
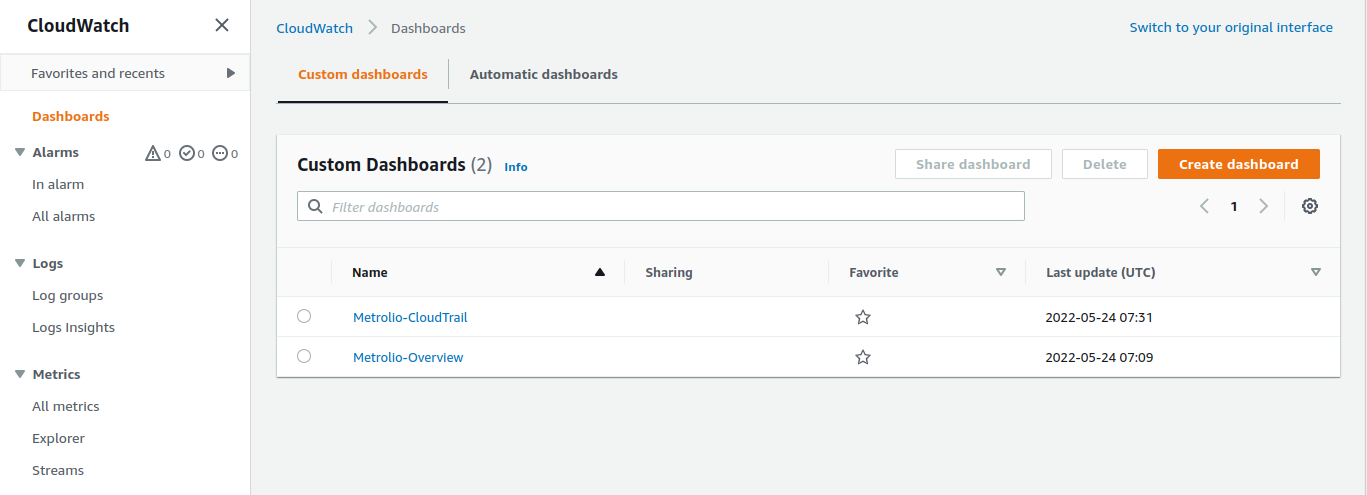
Searching for and selecting CloudWatch from the main console homepage will take you to the homepage above. Using the left-hand menu, you can navigate to all the main CloudWatch functionalities, such as dashboards, alarms, log groups, and metrics.
Selecting the dashboard on the left will let you see any custom dashboards you have set up, create new ones, or switch to look at automatic dashboards that AWS creates for you. These are generated for different services and have useful widgets pre-configured. If you want to make your own dashboard, it’s worth looking at the automatic ones for inspiration.
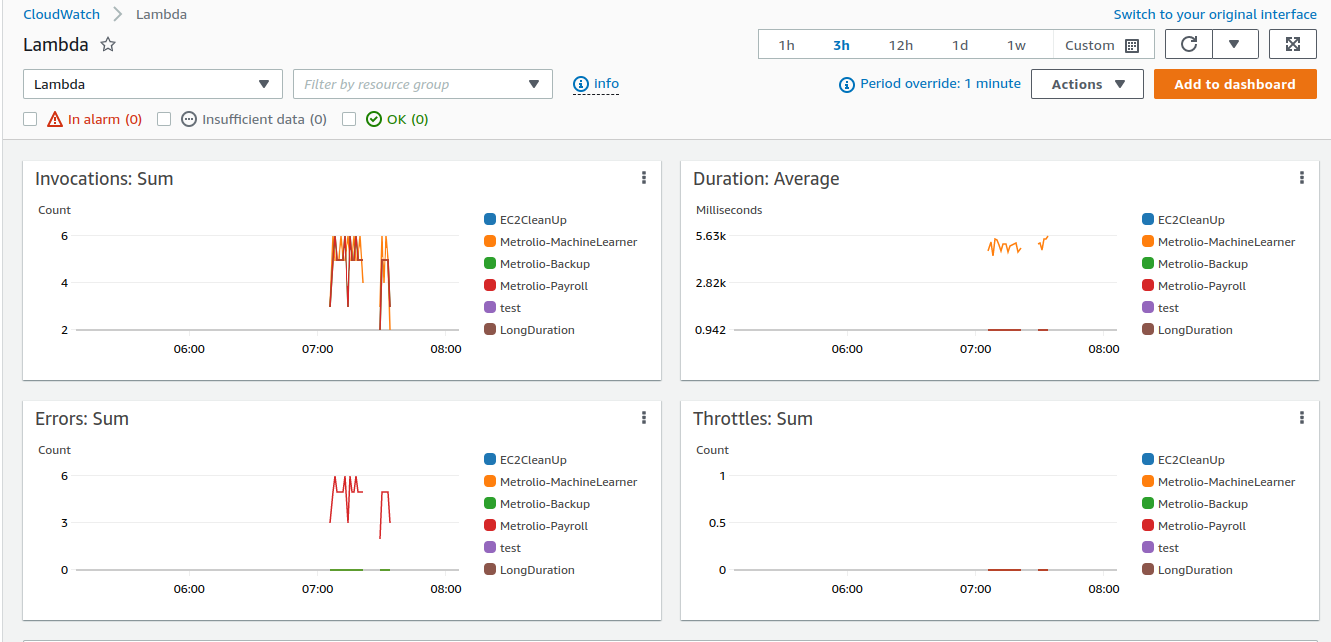
Selecting a dashboard will open it up and display any configured widgets. A widget is what AWS calls the components of the dashboards. In the screenshot above, you can see four line graph widgets. There are many widgets for different kinds of visualization – we'll explore several in this lab.
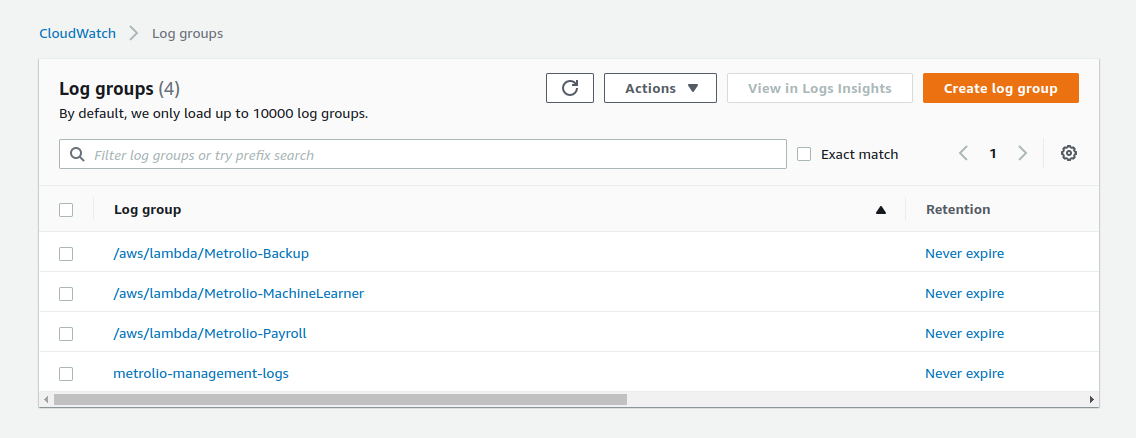
Selecting Log groups from the left-hand menu will let you see the log groups in your selected region. You can dig in and see the log streams in each group and even view individual logs. CloudWatch lets you filter using metric filters.
### Creating widgets
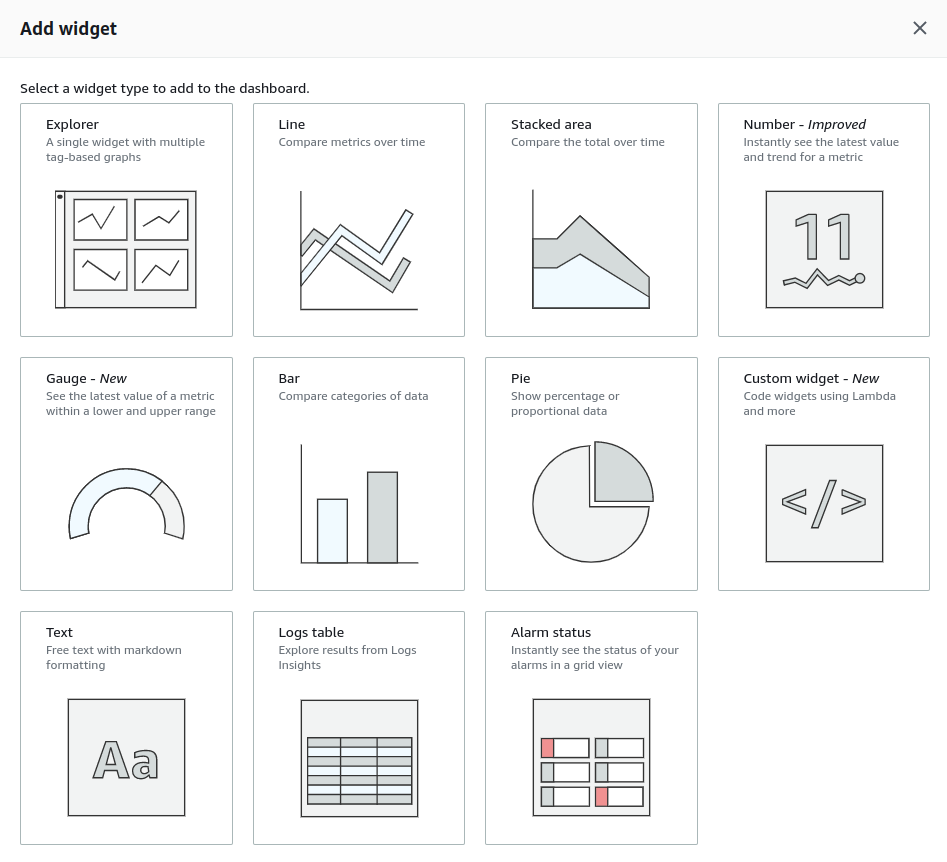
From a custom dashboard, selecting Add widget will present you with all the options available. Each one will have a slightly different setup process, the details of which are [covered in the AWS documentation](https://docs.aws.amazon.com/AmazonCloudWatch/latest/monitoring/create-and-work-with-widgets.html).
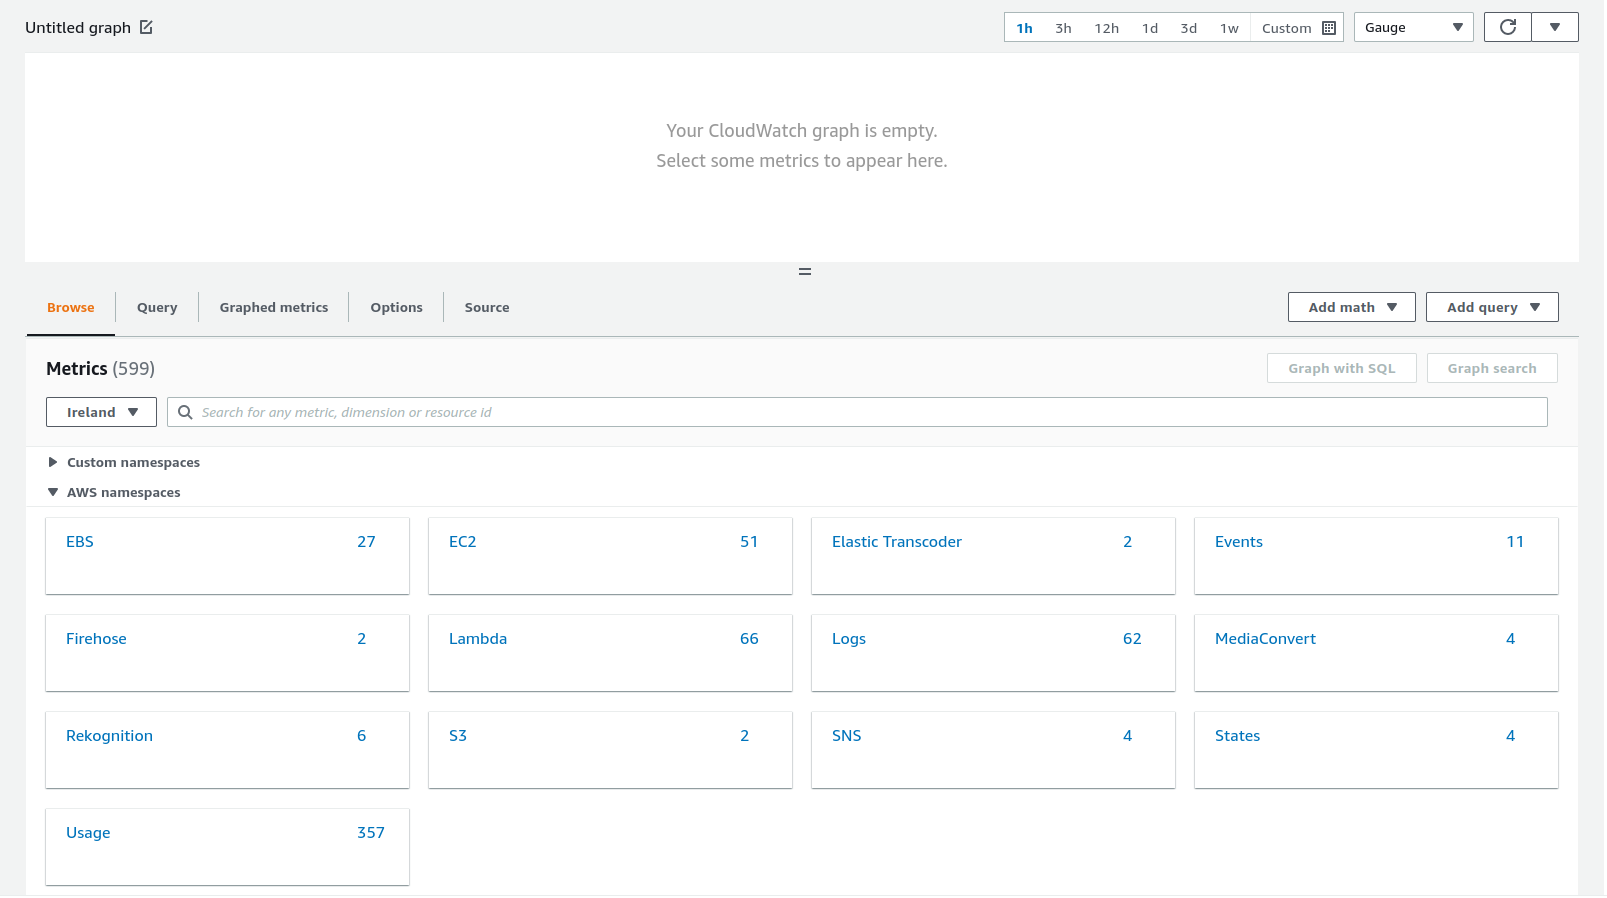
For most widgets, you'll see a screen similar to the image above, where you select the metric you want the widget to use as its data source. AWS groups metrics into separate namespaces per service, but you can also create your own.
The Graphed metrics tab will let you set the widget's statistical options, such as whether you want to show average values over a time period or the sum of the values. It also lets you define the period you want to be measuring over. More widget-specific configurations can usually be found in the Options tab. The Source tab lets you see the widget's configuration as a JSON object, which helps copy widgets across different dashboards or use one as a template.
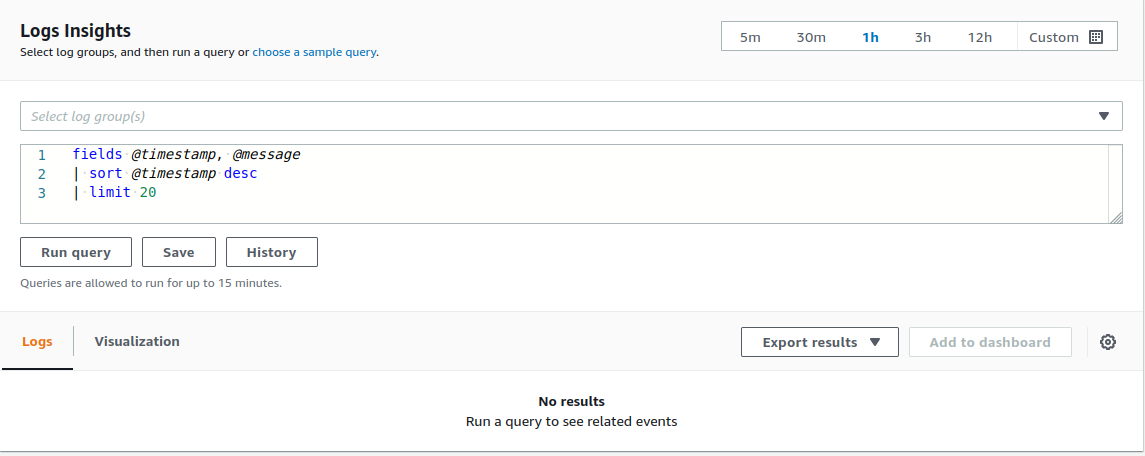
A log table widget will display recent logs from the specified log group. Choosing to create one will present you with the screen above, where you can write a query to filter the logs you want to be displayed. This comes auto-filled with a filter that shows the timestamp and message of the log file, sorts them with the most recent at the top, and limits the number of logs displayed to 20. AWS provides [documentation](https://docs.aws.amazon.com/AmazonCloudWatch/latest/logs/CWL_QuerySyntax-examples.html) about constructing queries for different use cases.
### Reading widgets
Some widgets are straightforward to read, such as those that display a single number representing the latest value of a specific metric or ones that let you see the newest log files from particular sources. However, some of the graphs require some context to understand.
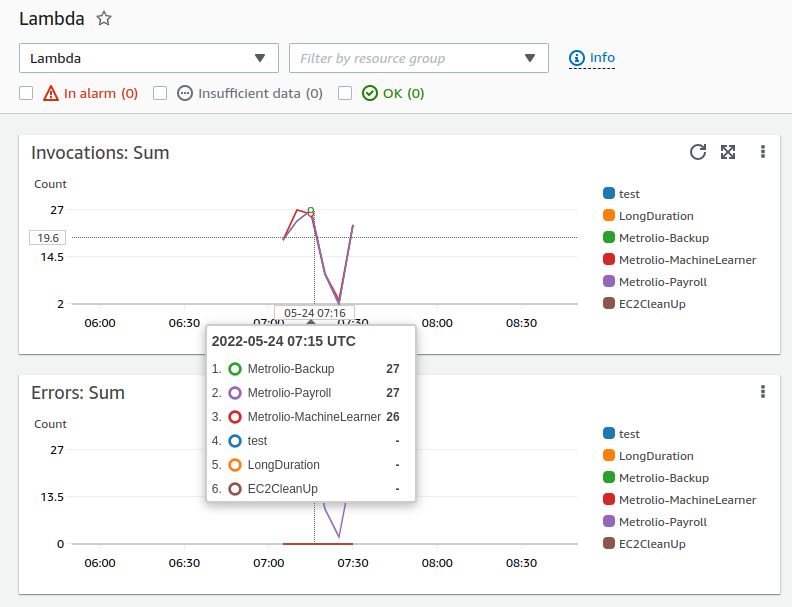
In the screenshot above, the user has hovered over a line graph showing the sum of invocations of different lambda functions. The period of the graph is set to five minutes, so moving the cursor left or right will let you see the number of times each lambda function was invoked in that time period. You can see the numerical values in the pop-out and the color key of the different functions. In this example, for the five minutes starting at 07:15 (times are in UTC), the function called Metrolio-Backup was invoked 27 times.